Difficulty
Moderate
Steps
8
Time Required
- OpenEVSE WiFi (Beta) 8 steps

In Progress
This guide is currently being written. Reload periodically to see the latest changes.
Quiz
0
-
-
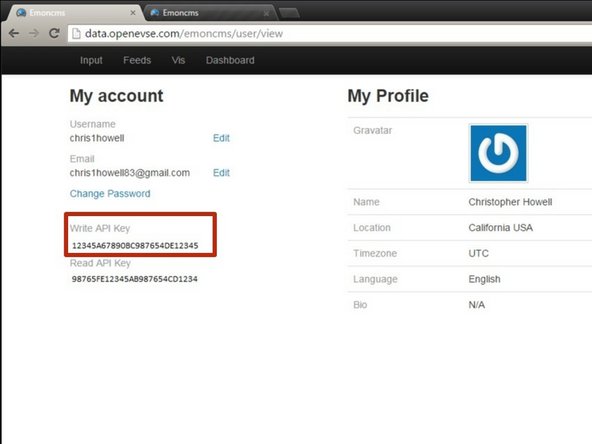
Setup Free account at: OpenEVSE Energy Monitoring
-
Enter Username, Email and Password to register for an Account.
-
On the account screen copy your Write API Key.
-
-
-
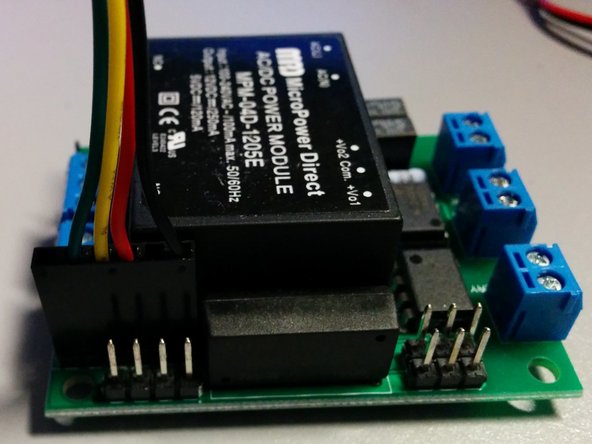
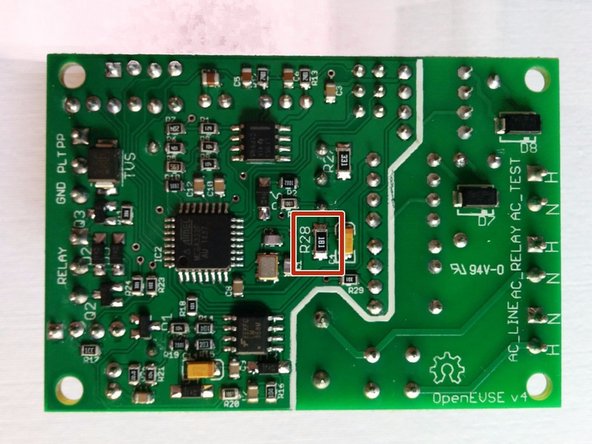
Remove the minimum load resistor (if installed) R28 on the OpenEVSE board v2.5, 3, and 4. Connect the cable to the OpenEVSE Board and Wifi Module.
-
The header is the common FTDI format.
-
Pin 1 - Ground (Black)
-
Pin 3 - 5v (Red) - 75ma max Higher power devices must use external power.
-
Pin 4 - Recieve (Yellow) connects to transmit on the remote device.
-
Pin 5 - Transmit (Green) connects to receive on the remote device.
-
Because both boards use the same pin-out pin 5 and pin 5 must be crossed so transmit on one board connects to receive on the other.
-
Use alcohol pad to clean enclosure at the desired mount location. When dry remove the plastic on the high temp industrial double sided tape and attach WiFi module to enclosure.
-
-
-
WIth a phone or laptop connect to WiFi network.
-
SSID: OpenEVSE
-
Password: openevse
-
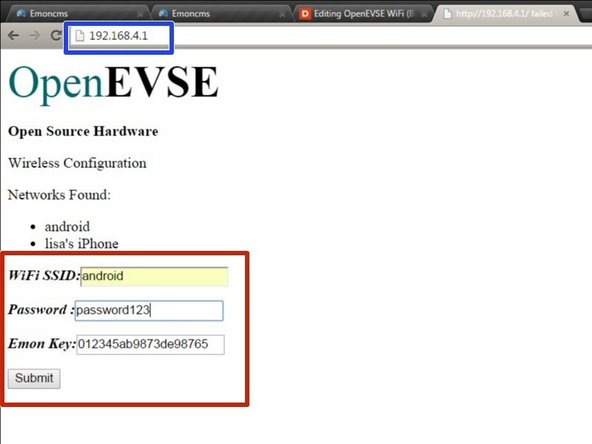
Once connected use a web browser to configure the WiFi Module:
-
Address: 192.168.4.1
-
Enter the SSID and Password of YOUR access point.
-
Enter the Write API Key from Step 1 for the Energy Monitoring (EMON) Key.
-
Click Submit.
-
-
-
The Wifi Module will now try to connect to your Wifi Network.
-
If the WiFi module can not connect it will start up in Configuration mode as "OpenEVSE" again.
-
Go back to OpenEVSE Energy Monitoring
-
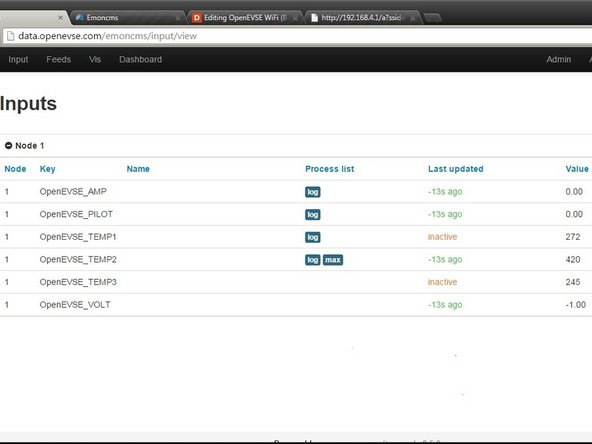
Select Inputs - The Inputs section should now display live data from OpenEVSE.
-
Inputs from other sensors can be included such as additional current, temperature, humidity, voltage etc. See Open Energy Project
-
Inputs displays live data from the sensors. This data is not stored, logged or archived.
-
-
-
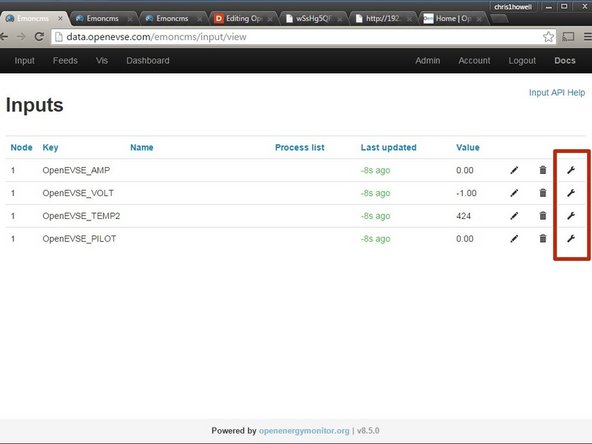
Feeds take data from the inputs and logs the data to the database. Feeds can also manipulate the data before logging.
-
Example you can take a volt feed and multiply a current feed to log a KwH value.
-
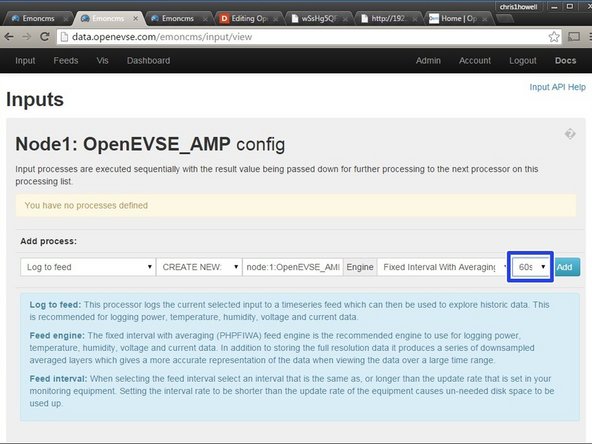
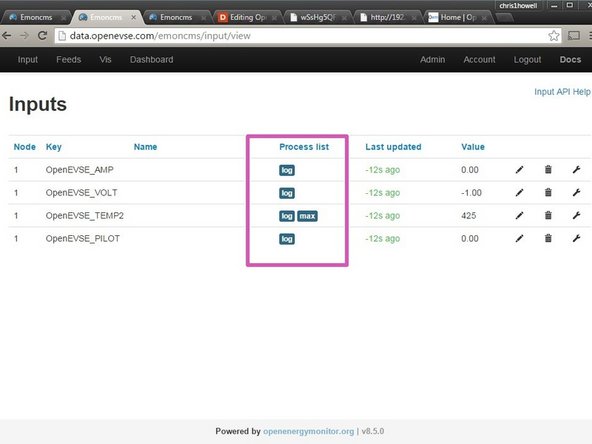
Create a Feed for each Input you wish to log. Click the Wrench icon on the right side of the Inputs page.
-
Energy Data from OpenEVSE is slowly changing. To avoid unnecessary data usage change log intervel to 60s.
-
Tip - Add a feed for max value of temperature sensors (if Installed).
-
-
-
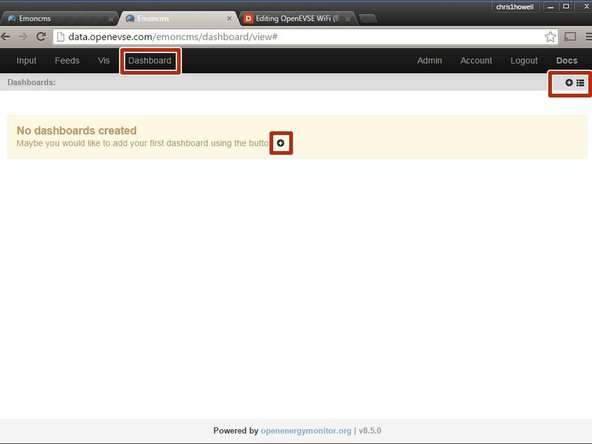
Dashboards display data logged from the feeds. You can create as many dashboard views as you wish.
-
Click on the + icon to create your first Dashboard.
-
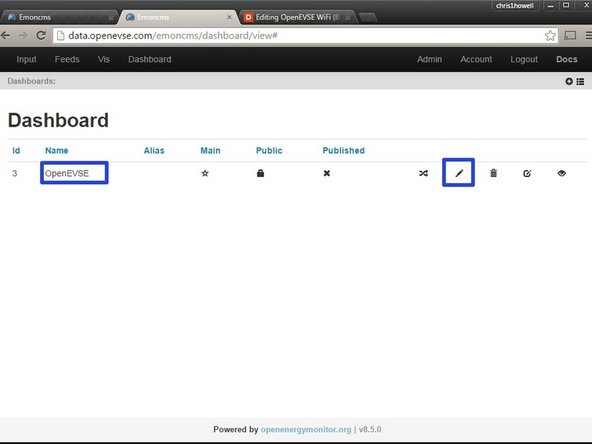
The name can be edited by clicking on the pencil icon.
-
-
-
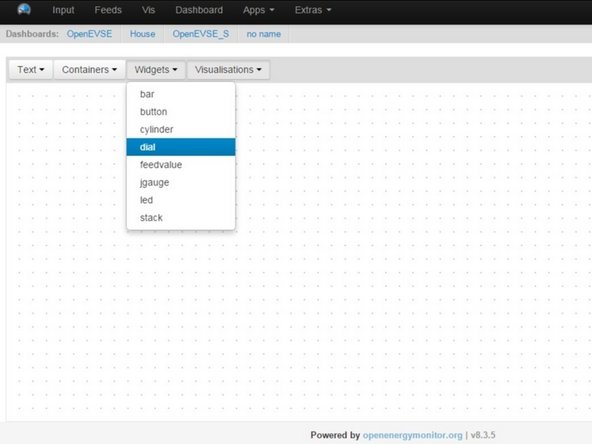
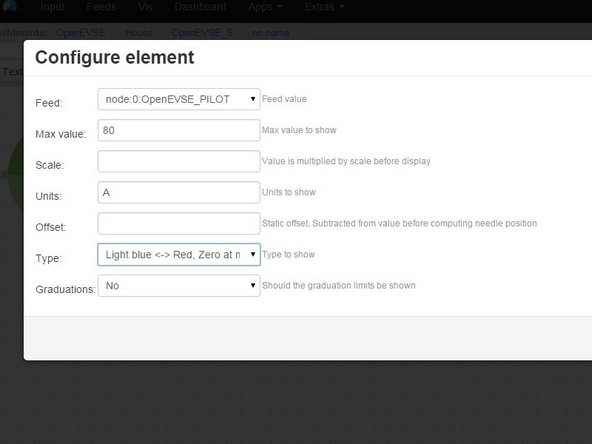
Select Widgets > Dial
-
Click on grid to place the dial. Move, re-size and adjust as desired.
-
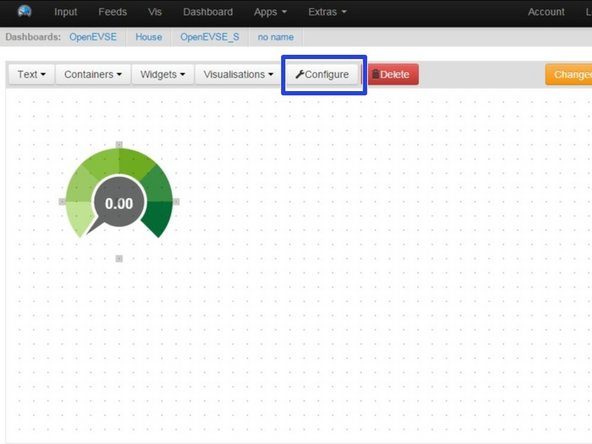
Click "Configure"
-
Select Feed - Set Max Value - Set Units - Pick Type
-
-
-
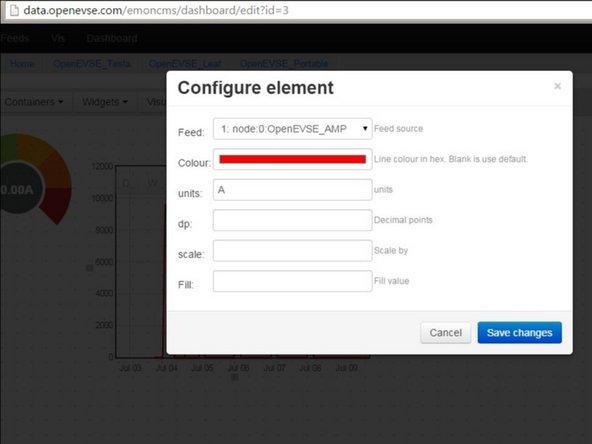
Click on Visualizations > Rawdata. Click on the grid to add click then Configure.
-
Select Feed, Color and Units
-
Move and scale as desired.
-