Difficulty
Moderate
Steps
9
Time Required
- OpenEVSE WiFi (Beta) 9 steps

Featured Guide
This guide has been found to be exceptionally cool by the site's staff.
Quiz
0
-
-
Setup Free account at: OpenEVSE Energy Monitoring
-
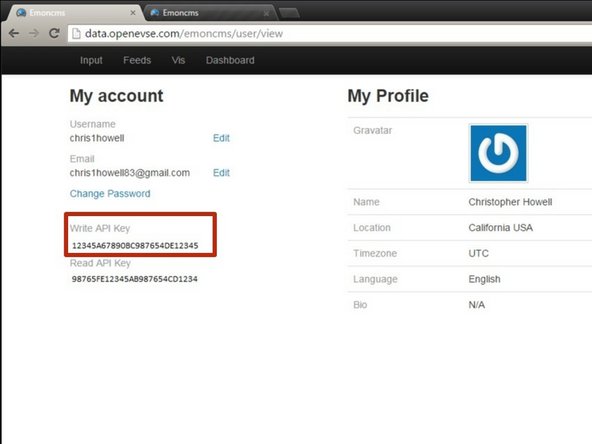
Enter Username, Email and Password to register for an Account.
-
On the account screen copy your Write API Key.
-
-
-
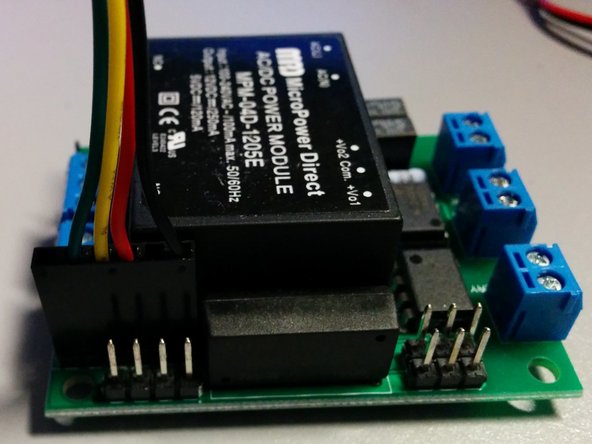
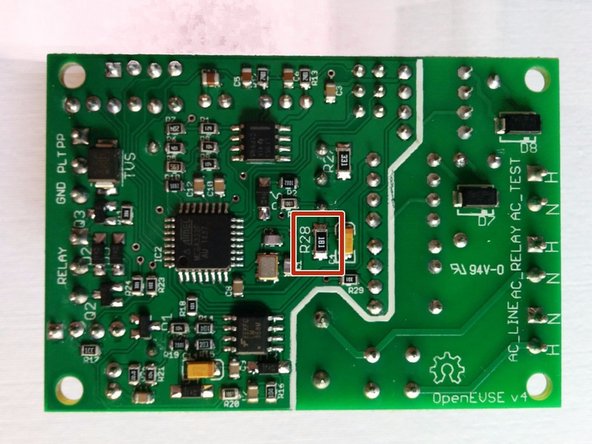
Remove the minimum load resistor (if installed) R28 on the OpenEVSE board v2.5, 3, and 4. Connect the cable to the OpenEVSE Board and Wifi Module. (HUZZAH ESP8266 Breakout board from ADAFRUIT is shown)
-
The header is the common FTDI format.
-
Pin 1 - Ground (Black)
-
Pin 3 - 5v (Red) - 75ma max Higher power devices must use external power.
-
Pin 4 - Recieve (Yellow) connects to transmit on the remote device.
-
Pin 5 - Transmit (Green) connects to receive on the remote device.
-
Because both boards use the same pin-out pin 5 and pin 5 must be crossed so transmit on one board connects to receive on the other.
-
Use alcohol pad to clean enclosure at the desired mount location. When dry remove the plastic on the high temp industrial double sided tape and attach WiFi module to enclosure.
-
-
-
WIth a phone or laptop connect to WiFi network.
-
SSID: OpenEVSE
-
Password: openevse
-
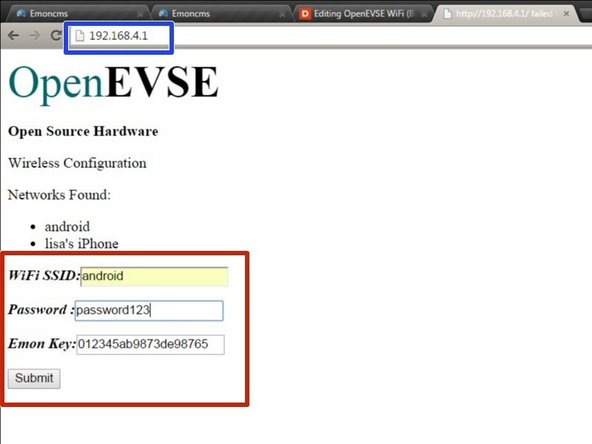
Once connected use a web browser to configure the WiFi Module:
-
Address: 192.168.4.1
-
Enter the SSID and Password of YOUR access point.
-
Enter the Write API Key from Step 1 for the Energy Monitoring (EMON) Key.
-
Click Submit.
-
-
-
The Wifi Module will now try to connect to your Wifi Network.
-
If the WiFi module can not connect it will start up in Configuration mode as "OpenEVSE" again.
-
Go back to OpenEVSE Energy Monitoring
-
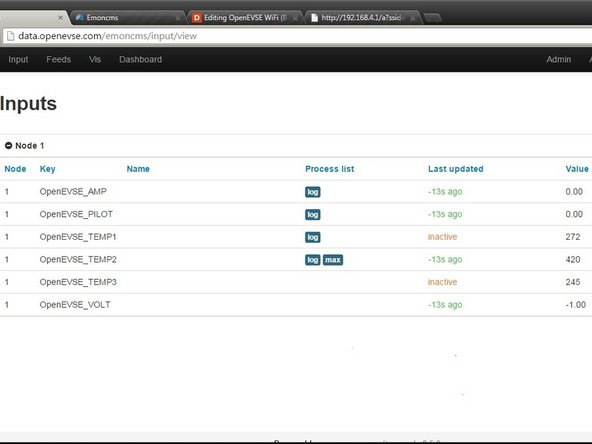
Select Inputs - The Inputs section should now display live data from OpenEVSE.
-
Inputs from other sensors can be included such as additional current, temperature, humidity, voltage etc. See Open Energy Project
-
Inputs displays live data from the sensors. This data is not stored, logged or archived.
-
-
-
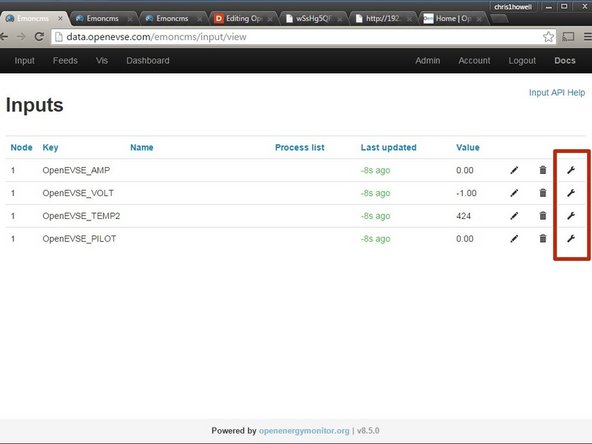
Feeds take data from the inputs and logs the data to the database. Feeds can also manipulate the data before logging.
-
Example you can take a volt feed and multiply a current feed to log a KwH value.
-
Create a Feed for each Input you wish to log. Click the Wrench icon on the right side of the Inputs page.
-
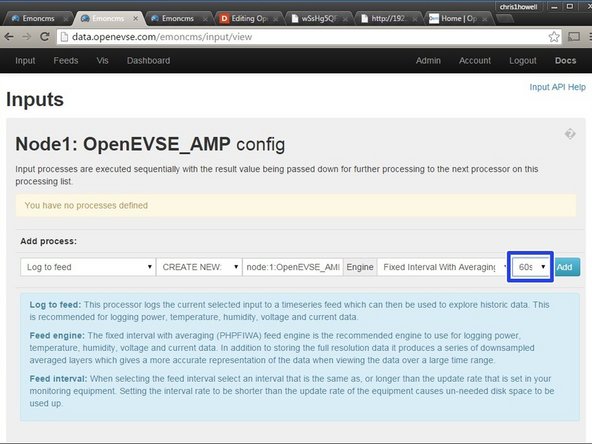
Energy Data from OpenEVSE is slowly changing. To avoid unnecessary data usage change log intervel to 60s.
-
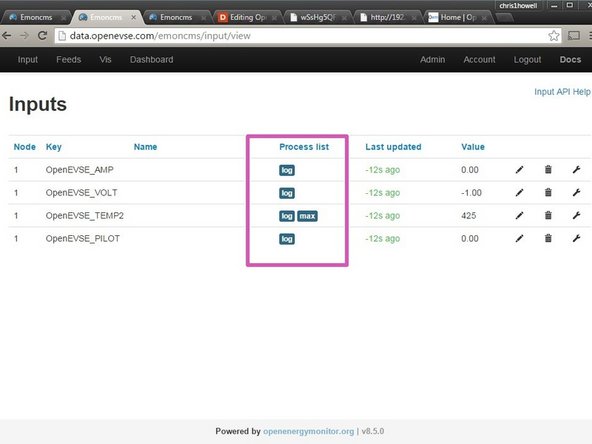
Tip - Add a feed for max value of temperature sensors (if Installed).
-
-
-
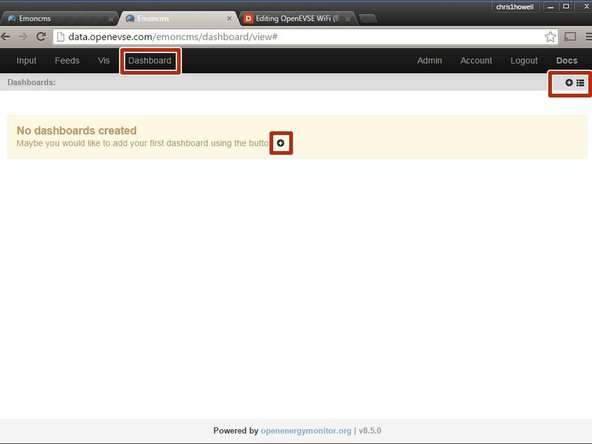
Dashboards display data logged from the feeds. You can create as many dashboard views as you wish.
-
Click on the + icon to create your first Dashboard.
-
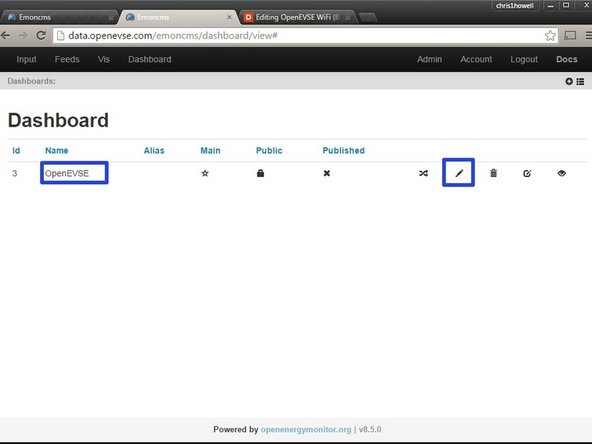
The name can be edited by clicking on the pencil icon.
-
-
-
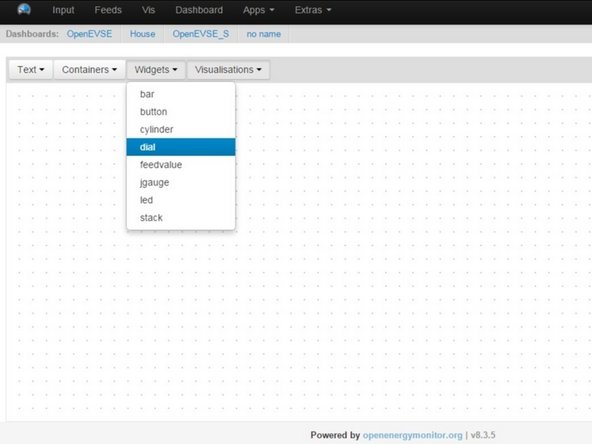
Select Widgets > Dial
-
Click on grid to place the dial. Move, re-size and adjust as desired.
-
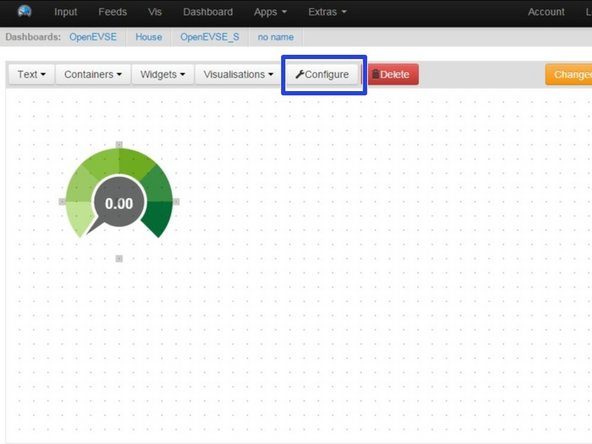
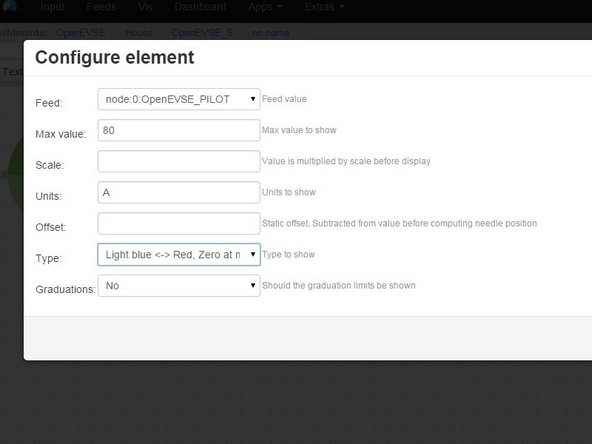
Click "Configure"
-
Select Feed - Set Max Value - Set Units - Pick Type
-
-
-
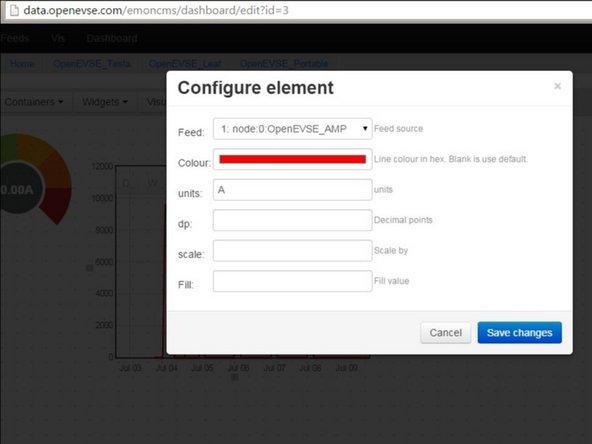
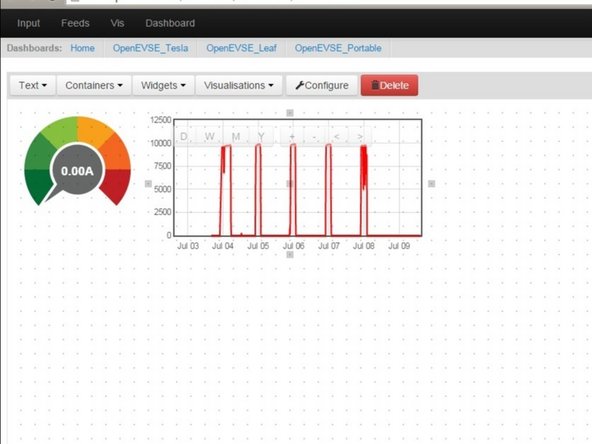
Add Rawdata charts for current and temprature. Click on Visualizations > Rawdata. Click on the grid to add click then Configure.
-
Select Feed, Color and Units
-
Move and scale as desired.
-
Save Changes
-
-
-
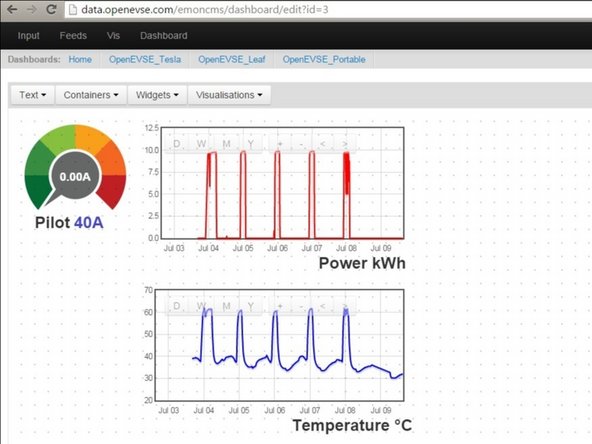
Add Text Labels
-
Feed values can be displayed. Click Widget > Feedvalue
-