Difficulty
Moderate
Steps
9
Time Required
- OpenEVSE WiFi (Beta) 9 steps

Featured Guide
This guide has been found to be exceptionally cool by the site's staff.
Quiz
0
-
-
Setup Free account at: OpenEVSE Energy Monitoring
-
Enter Username, Email and Password to register for an Account.
-
If using a generic ESP8266 or Huzzah Module without the OpenEVSE Wifi Firmware pre-loaded. Load firmware.
-
-
-
-
-
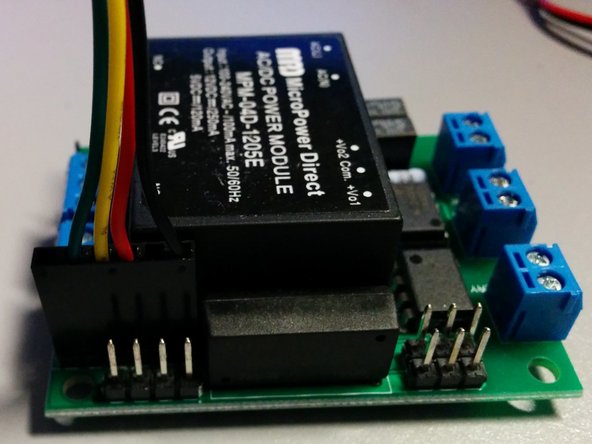
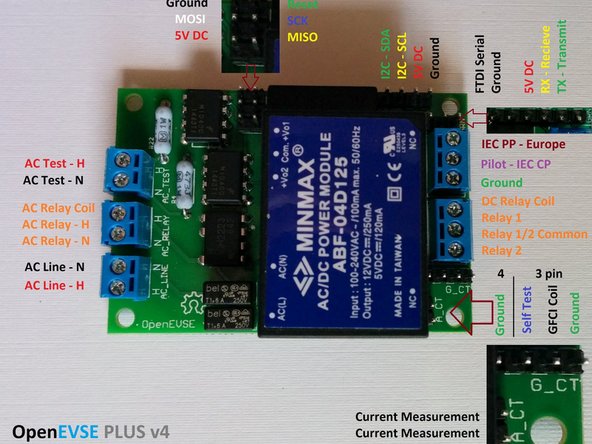
The header is the common FTDI format. Connect the Red (+) lead of UBEC Power module to the +12v header labeled RELAY 1/2 Common . Connect Black (-) to Ground.
-
Pin 1 - Ground (Black)
-
Pin 3 - 5v (Red) - 75ma max Higher power devices must use external power.
-
Pin 4 - Recieve (Yellow) connects to transmit on the remote device.
-
Pin 5 - Transmit (Green) connects to receive on the remote device.
-
Connect the the header with both power and data lined (4 of 6 wires) to the Wifi Module. Connect the data only (2 of 6 wires) to the OpenEVSE Board.
-
Use alcohol pad to clean enclosure at the desired mount location. When dry remove the plastic on the high temp industrial double sided tape and attach WiFi module to enclosure.
-
-
-
With a phone or laptop connect to http://data.openevse.com/emoncms/.
-
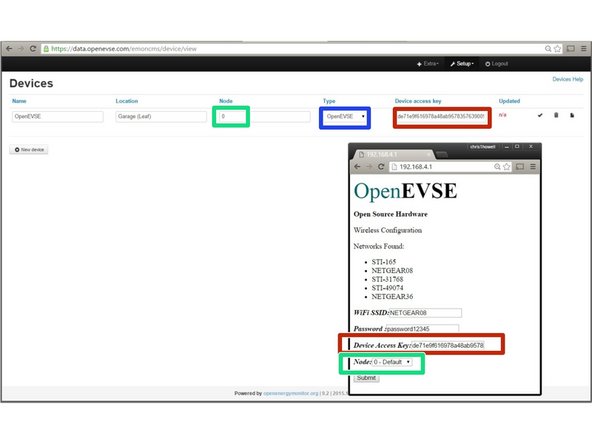
Navigate to Setup => Device Setup Click the Pencil icon to edit. Set Name, Description, Node (0-9), Type "OpenEVSE" and copy your Device Key.
-
Once device is setup connect to OpenEVSE WiFi to configure the WiFi Module:
-
SSID: OpenEVSE --- Password: openevse
-
Address: 192.168.4.1
-
Enter the SSID and Password of YOUR access point.
-
Enter the Device Key, Node (0-9) and set
-
Click Submit.
-
-
-
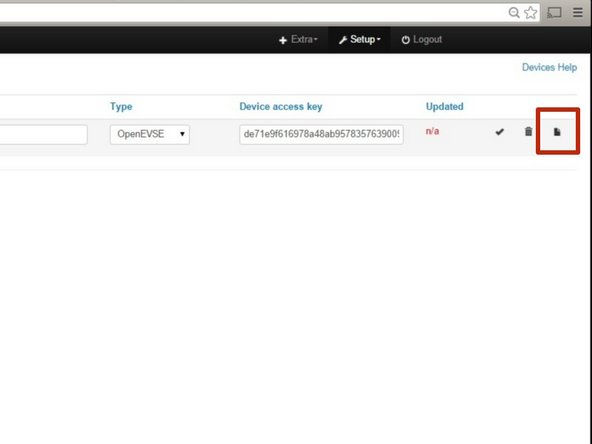
To automatically Setup Inputs and Feeds:
-
Navigate to Setup => Device Setup
-
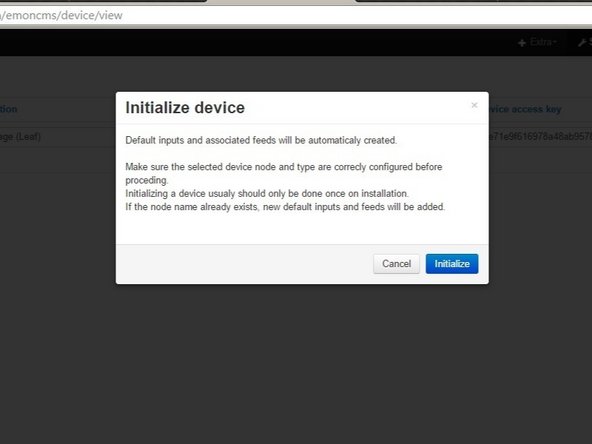
Click the Paper Icon to Initialize the Device.
-
Click Initialize to confirm.
-
Inputs and Feeds should now be setup.
-
-
-
The Wifi Module will now try to connect to your Wifi Network.
-
If the WiFi module can not connect it will start up in Configuration mode as "OpenEVSE" again.
-
Go back to OpenEVSE Energy Monitoring
-
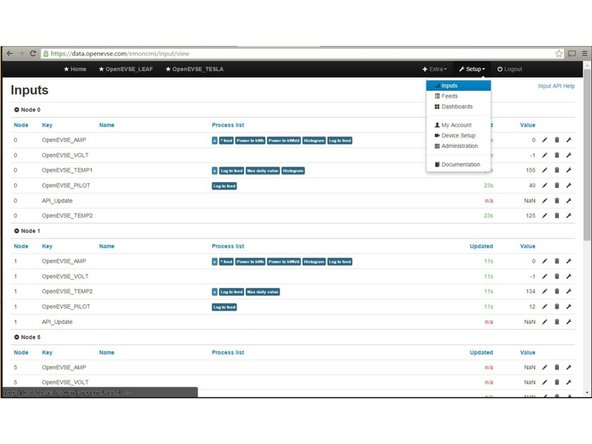
Select Inputs - Navigate to Setup => Inputs. The Inputs section should now display live data from OpenEVSE.
-
Inputs from other sensors can be included such as additional current, temperature, humidity, voltage etc. See Open Energy Project
-
Inputs displays live data from the sensors. This data is not stored, logged or archived.
-
-
-
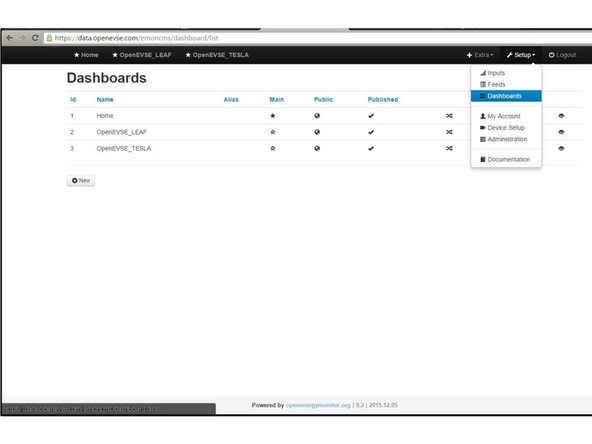
Dashboards display data logged from the feeds. You can create as many dashboard views as you wish.
-
Click on the + icon to create your first Dashboard.
-
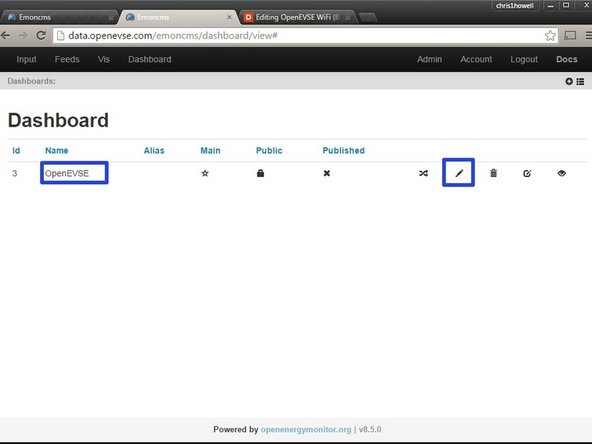
The name can be edited by clicking on the pencil icon.
-
-
-
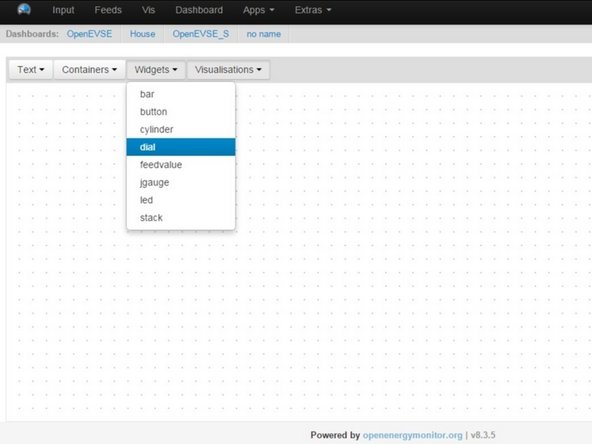
Select Widgets > Dial
-
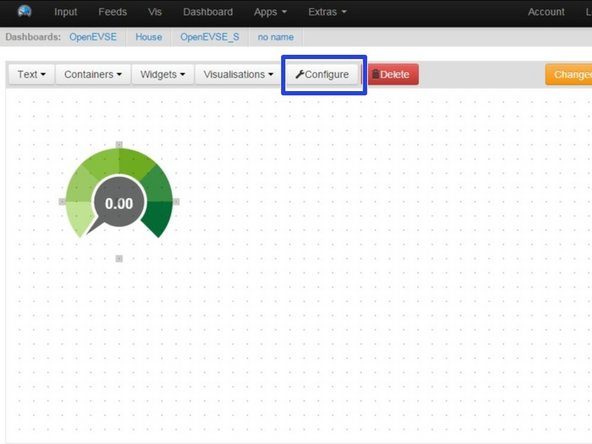
Click on grid to place the dial. Move, re-size and adjust as desired.
-
Click "Configure"
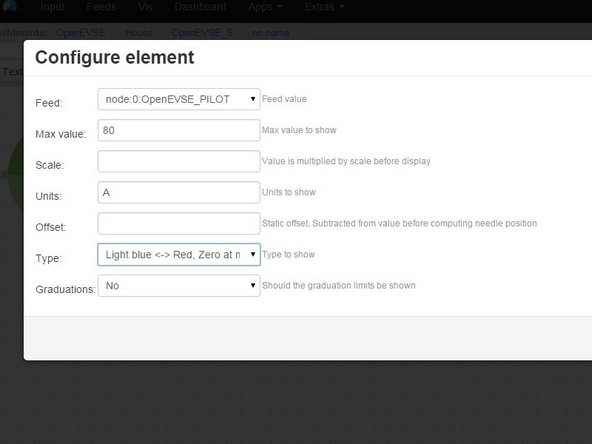
-
Select Feed - Set Max Value - Set Units - Pick Type
-
-
-
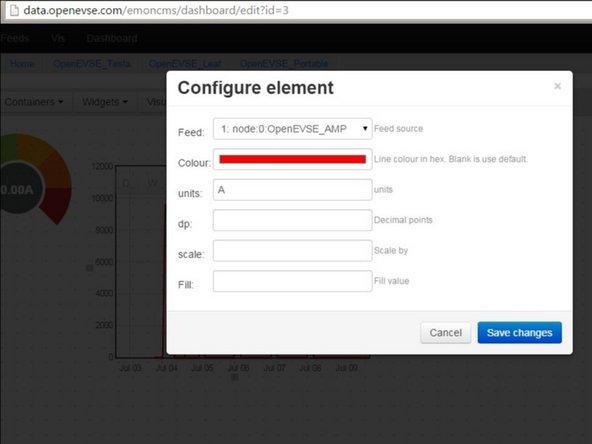
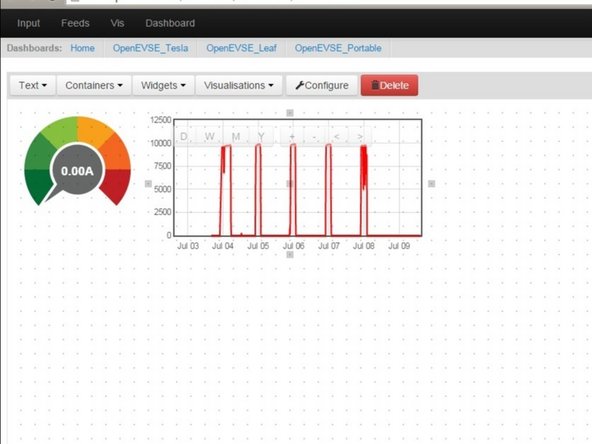
Add Rawdata charts for current and temprature. Click on Visualizations > Rawdata. Click on the grid to add click then Configure.
-
Select Feed, Color and Units
-
Move and scale as desired.
-
Save Changes
-
-
-
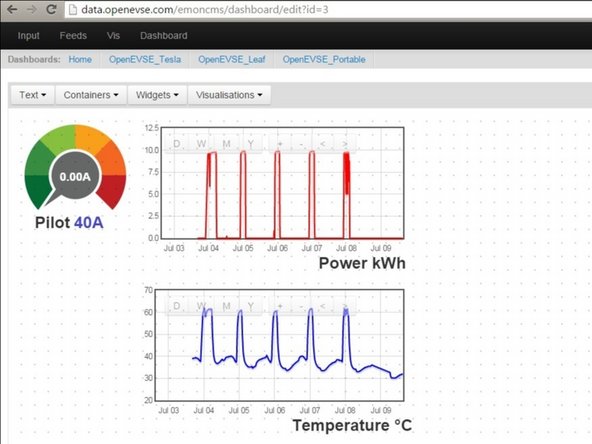
Add Text Labels
-
Feed values can be displayed. Click Widget > Feedvalue
-